On this website we can find an interesting and simple function to plot the outliers of a variable and its values: https://www.r-bloggers.com/plot-outliers-and-their-values/ …
About jose
Profesor titular del Dpto. de Estadística e I.O. de la Usal. Entusiasta del software estadístico R.COVID-19: The Case of Spain
ESTA ENTRADA NO TIENE ACTUALIZACIONES EN ESTA WEB / THIS ENTRY DOES NOT HAVE UPDATES ON THIS WEB HA SIDO MOVIDA A / HAS BEEN MOVED TO: https://github.com/josemss/Covid19 ———————— (1) SIR MODEL I will use the same model used in this post: Epidemiology: How contagious is Novel Coronavirus (2019-nCoV)?. You can find all the details there and in the […]
R pill: “Enter a vector or matrix in the R console using the keyboard”
When we have few numerical data, either in a small vector or in a matrix of small dimensions, we can create a “vector” or “matrix” object in the R working environment using the “scan ()” function and entering the data with the keyboard on the R console. Examples: * foo1() is a function that asks […]
R pill: “Install packages from Bioconductor”
Bioconductor provides tools for the analysis and comprehension of high-throughput genomic data. Bioconductor uses the R statistical programming language, and is open source and open development. Visit https://www.bioconductor.org/ for more information. Example: Install “affy” and “AnnotationDbi” packages to manage tools for Affymetrix microarrays. The conditional “if” is used to check if we already have a package installed. # […]

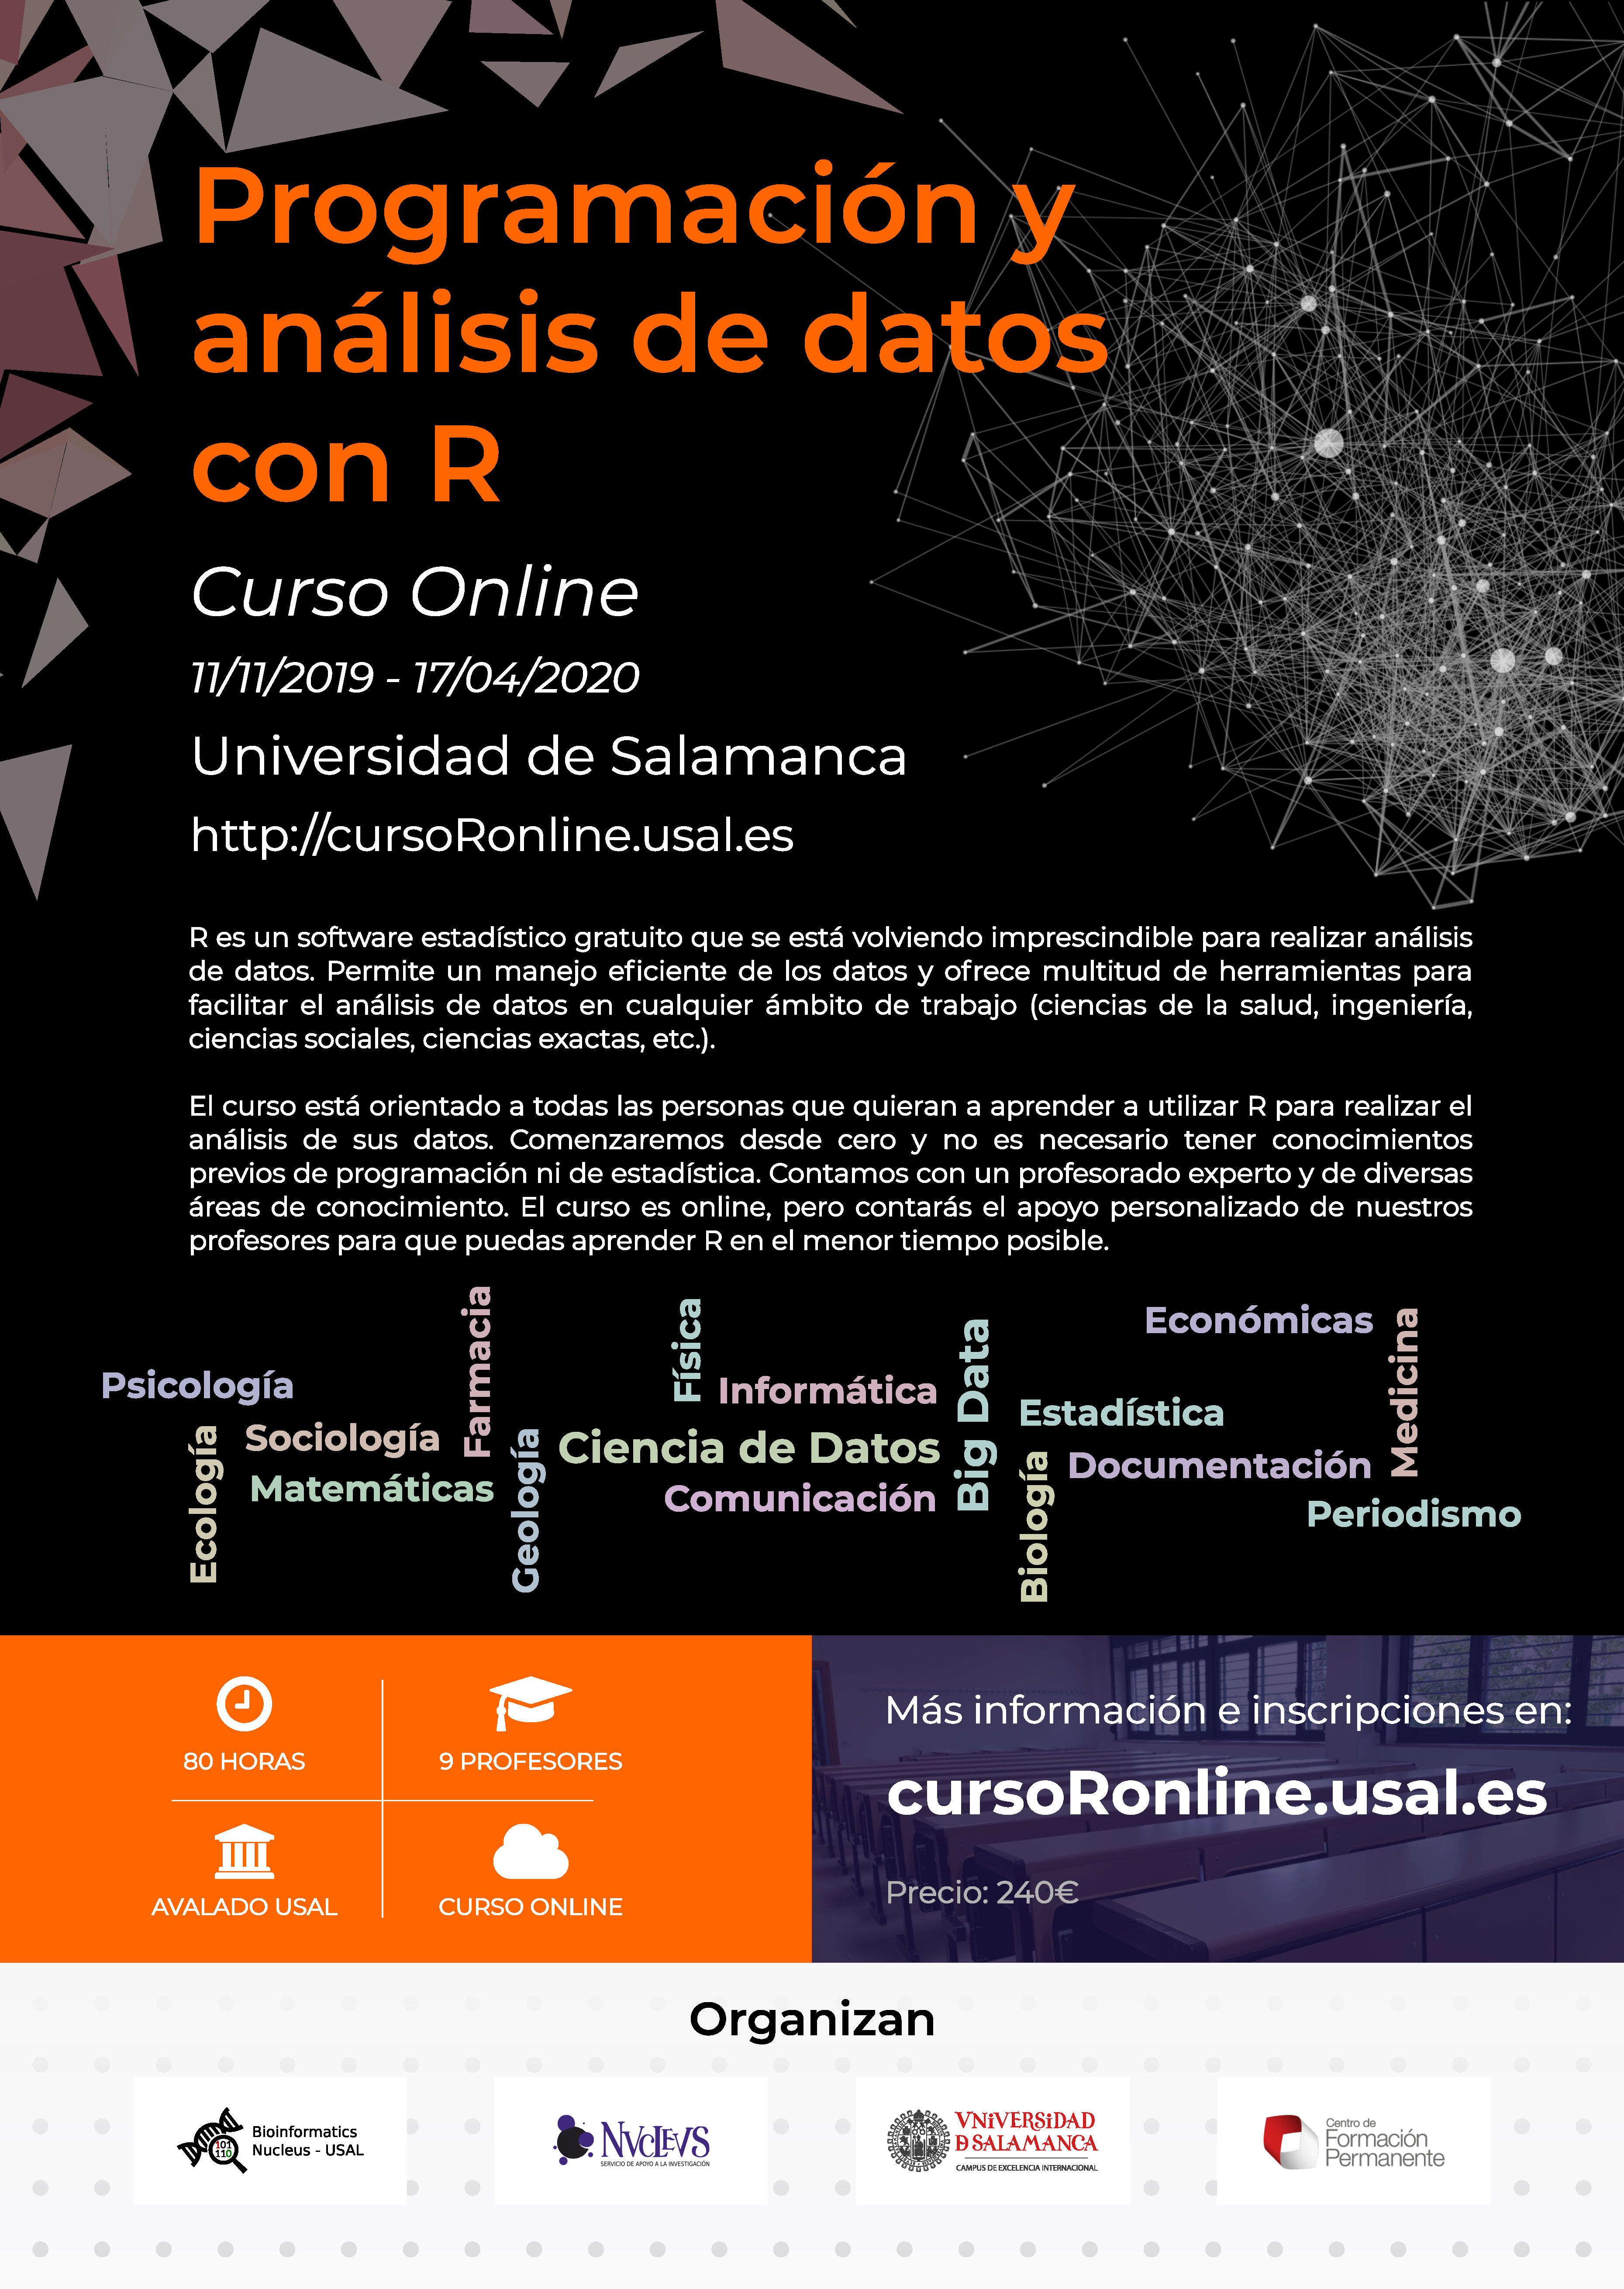
Programación y análisis de datos con R – Curso online
R online course: http://cursoronline.usal.es/ Universidad de Salamanca Se imparte anualmente. Fechas en el enlace.
CheatSheet for Rstudio interface
On the web (https://www.rstudio.com/resources/cheatsheets/#ide) you can download a cheat sheet for a quick handling of the RStudio interface.
Package ‘readxl’: read Excel files
Import excel files into R. Supports ‘.xls’ via the embedded ‘libxls’ C library <https://sourceforge.net/projects/libxls/> and ‘.xlsx’ via the embedded ‘RapidXML’ C++ library <https://rapidxml.sourceforge.net>. Works on Windows, Mac and Linux without external dependencies. https://cran.r-project.org/web/packages/readxl/. To install run on console: install.packages(“readxl”).
Package ‘foreign’: read all data types (except Excel)
An essential package for creating objects in R by importing data from almost any known format: ‘Minitab’, ‘S’, ‘SAS’, ‘SPSS’, ‘Stata’, ‘Systat’, ‘Weka’, ‘dBase’, … https://cran.r-project.org/package=foreign CRAN – Package foreign. To install run on console: install.packages(“foreign”)
RStudio: The best interface for R
RStudio is an integrated development environment (IDE) for R. It includes a console, syntax-highlighting editor that supports direct code execution, as well as tools for plotting, history, debugging and workspace management. vía RStudio – RStudio. Download and install: https://www.rstudio.com/products/rstudio/download/
R: The R Project for Statistical Computing
R is a free software environment for statistical computing and graphics. It compiles and runs on a wide variety of UNIX platforms, Windows and MacOS. R: The R Project for Statistical Computing. R is a language and environment for statistical computing and graphics. It is a GNU project which is similar to the S language […]


Comentarios recientes